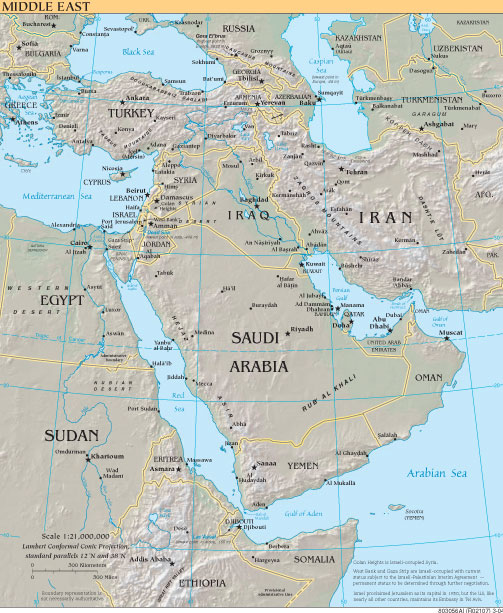
The table below
shows economic and population data on the nations of the Middle
East. The Gross Domestic Product (GDP), is an indicator of
the overall strength of a nation's economy, while the GDP per
capita shows the relative wealth of the population per person.
Infant Mortality Rate is the number of deaths of infants
under one year of age in a given year per 1,000 live births in the
same year. This rate is often used as an indicator of the level of
health and poverty in a country. High numbers are bad, as they
show large numbers of child deaths, while low numbers are good,
showing a high number of children surviving to see their first
birthday. Generally, the wealth of a nation and the education rate
among the population, (especially among women), are indicated by
low infant mortality rates. Conversely, the poorer the nation and
low-levels of education are reflected by high infant death
numbers.
|
Country
|
GDP (In U.S.
Dollars)
|
GDP Per Capita
(In U.S. Dollars)
|
Population
|
Population
below the Poverty Line
|
Unemployment
Rate
|
Infant
Mortality Rate
|
Life Expectancy
@ birth
|
|
Bahrain
|
$13.01
billion
|
$19,200
|
688,345 (includes
235,108 non-Bahrainians)
|
Not
available
|
15%
|
17.27 deaths/1,000
live births
|
74.23 years
|
|
Egypt
|
$316.3 billion
|
$4,200
|
77,505,756
|
16.7%
|
10.9%
|
32.59 deaths/1,000
live births
|
71 years
|
|
Iran
|
$516.7
billion
|
$7,700
|
68,017,860
|
40%
|
11.2%
|
41.58 deaths/1,000
live births
|
69.96
years
|
|
Iraq
|
$54.4 billion
(2004 est.)
|
$2,100
|
26,074,906
|
Not
available--Probably high
|
25% to
30%
|
50.25 deaths/1,000
live births
|
68.7
years
|
|
Israel
|
$129 billion
|
$20,800
|
6,276,883
|
18%
|
10.7%
|
7.03 deaths/1,000
live births
|
79.32 years
|
|
Jordan
|
$25.5
billion
|
$4,500
|
5,759,732
|
30%
|
15% official rate;
unofficial rate is approx. 30%
|
17.35 deaths/1,000
live births
|
78.24
years
|
|
Kuwait
|
$48
billion
|
$21,300
|
2,335,648
(includes 1,291,354 non-Kuwaitis)
|
Not
available
|
2.2%
|
9.95 deaths/1,000
live births
|
77.03
years
|
|
Lebanon
|
$18.83
billion
|
$5,000
|
3,826,018
|
28%
|
18%
|
24.52 deaths/1,000
live births
|
72.63
years
|
|
Oman
|
$38.09
billion
|
$13,100
|
3,001,583
(includes 577,293 non-Omanis)
|
Not
available
|
15%
|
19.51 deaths/1,000
live births
|
73.13
years
|
|
Qatar
|
$19.49
billion
|
$23,200
|
863,051
|
Not
available
|
2.7%
|
18.61 deaths/1,000
live births
|
73.67
years
|
|
Saudi
Arabia
|
$310.2
billion
|
$12,000
|
26,417,599
|
Not
available
|
25%
|
13.24 deaths/1,000
live births
|
75.46 years
|
|
Syria
|
$60.44
billion
|
$3,400
|
18,448,752
|
20%
|
20%
|
29.53 deaths/1,000
live births
|
70.03 years
|
|
Turkey
|
$508.7
billion
|
$7,400
|
69,660,559
|
20%
|
9.3% (plus
underemployment of 4.0%)
|
41.04 deaths/1,000
live births
|
72.36
years
|
|
United Arab
Emirates (UAE)
|
$63.67
billion
|
$25,200
|
2,563,212
(includes an estimated 1,606,079 non-nationals)
|
Not
available
|
2.4%
|
14.51 deaths/1,000
live births
|
75.24
years
|
|
Yemen
|
$16.25
billion
|
$800
|
20,727,063
|
45.2%
|
35%
|
61.5 deaths/1,000
live births
|
61.75
years
|
|
|
|
|
|
|
|
|
|

Source: The
CIA World Factbook
Please cite this source when appropriate:
Lee, R. "The History Guy:
Middle Eastern Economic & Population Data "
http://www.historyguy.com/nations/middle_east_economics.html
Copyright
© 1998-2006 Roger A. Lee and History Guy Media; Last Modified:
01.08.06

 ®
®
